
Try it
Check your file before you upload it anywhere
The first question in any thermal analysis is whether the file contains measurement data at all. This check runs here in your browser, on the original file, without uploading it anywhere.
Compatibility check
Local file check
The check reads the file structure and reports what is in it: whether radiometric data segments are present, which camera is recorded in the metadata, and the image dimensions. It does not analyse the image and does not compute temperatures.
Drag a file here, or
Original camera file, up to 30MB. Supported: JPG/JPEG.
Analysis on a real image
Element identification on a field thermal image
The images below are real radiometric thermal images. The boxes and values were not drawn by hand: they are the output of running the platform’s identification model over the image at a standard confidence threshold.
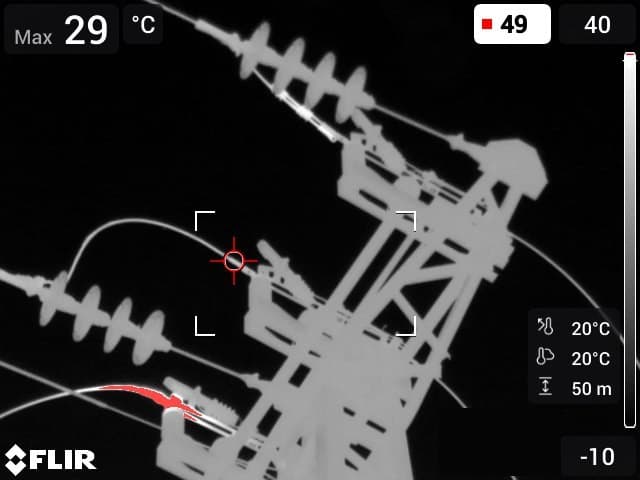 #1267°CDisconnector main contact — Severity: Three stars
Severity by comparative ΔT
The temperatures here were measured from the radiometric data in the file, not read off the burned-in display. Severity comes from the temperature difference against a comparable component of the same type — never from the maximum value alone.
- Component
- Disconnector main contact
- Maximum on the hot component
- 266.6 °C
- Comparable reference component
- 22.8 °C
- Comparative ΔT
- 243.8 °C
- Severity
- Three stars
Severity scale
| Comparative ΔT | Severity |
|---|---|
| Below 20°C | Below threshold |
| 20–29°C | One star |
| 30–40°C | Two stars |
| Above 40°C | Three stars |
Measurement parameters from the file
- Emissivity
- 0.98
- Reflected apparent temperature
- 20 °C
- Object distance
- 50 m
Identified components
Run details
- Model file
- pole_elements.onnx
- Architecture
- Ultralytics YOLO11n
- Input size
- 512 × 512
- Preprocessing
- letterbox to 512x512, RGB, /255, CHW
- Confidence threshold
- 0.25
- Overlap threshold (NMS)
- 0.45
- Image size
- 640 × 480
- Detections
- 7
- Parity with the application
- Not verified
Sample analysis
What a result looks like
Suggested findings
Select a finding to highlight the matching region in the image.
Run details
- Status
- Experimental analysis — sample data
- Image source
- Synthetic scene prepared for illustration
- Reference value
- Parallel component marked manually
- Engine version
- Shown from the actual run once the engine is connected
- Limitations
- No environmental context; indoor/outdoor classification not shown
The element identification layer
The platform identifies components on the structure, and sub-components within a component — for example the main contact and the blade of a disconnector. These are the component types the platform’s model actually identifies.
- Structurestructure
- Insulatorinsulator
- Clampclamp
- Disconnectordisconnector
- Disconnector main contactdisc_main
- Disconnector bladedisc_knife
- Cable terminationcable_term
- Transformertransformer
- Surge arresterarrester
The boxes here are drawn on a synthetic scene to show the structure. They carry no confidence values, because no model run happened here — a confidence value is shown only from a real run.
Service status
Upload for full analysis — next stage
The full analysis environment will open as a limited public trial, once the engine is packaged as a service and passes parity testing against an approved reference version and a golden file set. Until then you will not find an upload button here that returns results: a simulated result is worse than no result.
- The local check above works today, and reports only what is actually in the file.
- Full analysis will open first for a verified subset of camera models and files.
- A file outside the supported set receives an explicit message, not a partial analysis.
System messages
What the platform will tell you
These are the messages shown when analysis cannot continue. They are written to say what happened and what can be done — not to hide a limitation.
- No supported radiometric data was found in this file
- This camera model or file format is not yet supported
- The file exceeds the allowed size
- The photo and thermal data cannot be reliably aligned
- Part of the analysis is unavailable because required data is missing
- The file and results have been deleted
What happens to your file
- The local check runs in the browser; the file never leaves your device.
- When server-side analysis opens, files will be retained for a limited time and deleted automatically.
- Files are not used for model training by default.
- Location data and camera serial numbers are not displayed and not sent to analytics.
Not sure where this fits in your operation?
Tell us what equipment you inspect and what reporting looks like today, and we will come back with a concrete assessment.